In this section, there will be a large focus on Scheduling. By the end of the section, you should develop an understanding of how networks are used to solve resource allocation; scheduling issues and leveling issues. You should expect to see PERT, CPM and Network diagrams in great detail during the exam. You should know how they are constructed and how schedules are computed.
Time Processes throughout the Project Lifecycle
There are five processes that relate to time when it comes to the Project Lifecycle:
- Define Activities
- Sequence Activities
- Estimate Activity Resources
- Estimate Activity Durations
- Develop Schedule
- Control Schedule
PMI wants us to be comfortable with each of the activities and the role that they play throughout the Project Lifecycle.
| Exam Hint – Document original calculations in earlier questions as there is a good possibility that you might see the same example later in the question set. You should also be able to look at a PDM Method Diagram and calculate the Critical Path. For example, the question might ask you to calculate a new critical path based on new information provided by the question. |
Define Activities
This process adheres to the concept of decomposition that was discussed in the previous section on Project Scope Management. By this stage of project planning, we have created the scope baseline a.k.a the WBS and we now want to decompose the WBS into a greater level of detail, such that we can define the activities that need to be completed in order for the total project to be considered complete.
For the exam, you will have to familiarize yourself with some of the various practices and techniques for defining activities. Some of these techniques are well established and have been around for a long time.
PERT
The PERT or Program Evaluation and Review Technique was developed in the late 1950s by the consulting firm Booz, Allen and Hamilton for the US Navy during the Polaris Submarine Program. The PERT technique was developed together with the Work Breakdown Structure or WBS. The PERT works best in situations when an organization performs lot of projects that are similar in nature or repeats similar activities using a standardized process. For example, the US military used a well-defined and repeatable processes to build each submarine in the Polaris program. They could compare the durations that it took to perform a specific activity, such as installing a hatch or cover, across a number of different projects. PERT is also best suited to situations where there is flexibility when it comes to costs or budgets.
There are 3 Time Estimates found in PERT:
- Pessimistic Time Estimate
- Most Likely Time Estimate
- Optimistic Time Estimate
PERT is a Probabilistic Time Estimate. The purpose of these calculations is to determine the likelihood of completing a particular path activity or even the entire project based on that activity. While PERT used to be a dominant activity estimation tool, it is not used that frequently today. We tend to see PERT used a lot in Precedence Diagrams, which will be discussed later in this section. Two calculations used by PERT that you will need to know for the exams are listed below:
(A) Most Likely Time Estimate (PERT Mean):
{Pessimistic Estimate + (4 x Most Likely) + Optimistic Estimate} /6
(B) PERT Standard Deviation:
(Pessimistic Estimate – Optimistic Estimate) /6
You are not required to calculate PERT in the exam, just need to know how to find the PERT standard deviation, which is by subtracting the optimistic estimate from the pessimistic estimate and dividing the result by six. A lot of people tend to get confused with the different formulas. For example, in the exam you might be presented with some duration estimates and asked to choose the PERT Standard Deviation from a number of formulas. One of the answers they give you will be the answer for the PERT mean and not the Standard Deviation.
Critical Path Method (CPM)
The DuPont corporation and Remington Rand developed CPM or the Critical Path Method in the 1950s. The application of CPM in those days was for planning and scheduling Plant maintenance and construction programs. The emphasis in this case was with controlling costs while leaving the schedule flexible.
We don’t need the Pessimistic and the Optimistic time estimates for calculating CPM. We just need one data point for CPM and that is the most likely time estimate. In other words, your best guess is good enough as far as coming up with the duration required for a particular activity or time. We use CPM when building Activity-On-Arrow diagrams.
CPM is not that popular today, and while we tend to use one time estimates per activity in most instances, we typically use the PERT formula to obtain the most likely time estimate.
Precedence Diagramming Method
The PDM or Precedence Diagramming Method is considered to be more commonly used today for formulating activity duration estimates when compared to either CPM or PERT techniques. PDM was developed by a professor in Stanford University in the early 1960s and this method is also called Activity on Node.
To visualize an Activity on Node diagram, think of a picture of a network and you see boxes connected by lines and within the boxes are the activities. The lines between the boxes simply define the sequence of activities from one activity to the next.
Note that Activity on Node diagrams differ from Activity on Arrow or Activity on Line methods. Activities in the latter cases are depicted by lines in between the nodes. The activity is actually on the line and the nodes connecting the lines are simply identifiers of the activity itself.
Sequence Activities
For the exam, you will need to know the fundamental ways which networks are represented and how to construct and use network diagrams to calculate various characteristics of a project. Activity Sequencing follows up on the previous process, Activity Definition, by focusing on the appropriate sequence of performing activities now that they have been listed out.
At this point in the project, the planning team will be asking questions such as how particular tasks should be performed and in which sequence they should be carried out and if the tasks can be performed sequentially, in parallel or a combination of the two. The sequence could be linear, one after the other; or in parallel with certain tasks overlapping each other in certain cases. This largely depends on the nature of the work to be performed and how the various activities interact with one another..
Dependencies
When we do the sequencing, there are both hard and soft logics or Mandatory and Discretionary Dependencies that we need to pay attention to.
- Mandatory Dependency or hard logic typically involves a physical or technological limitation of the work. For example, a prototype must be built before it can be tested. There is no overlap of activities here, there is a clearly defined sequence. You have to build a prototype before you can test it.
- Discretionary Dependency or soft/ preferential logic is defined by a preference of how you would like to do something; how you might have done something in the past; or how your organization might dictate how a task is performed.
Examples of Discretionary Dependencies: We can find examples whenever there is a desire to sequence in a way that is desirable and customary. For instance, if you were doing plumbing and electrical work in sequence rather than in parallel, some people would prefer to perform one task and then move on to the other. However, it is not necessary to do so because of some mandatory dependency between the two. It is simply a matter of preference.
Another example is that some project management practitioners believe that the correct sequence in a project is that you must complete the concept phase before you can move to the design phase of the project lifecycle. This is not hard logic and is in fact preferential or soft logic.
| Exam Tip – External dependencies are defined as anything that is needed from outside sources other than the project team. For example, prototype and test results that you rely on an external organization to perform. A example PMI likes to use is in regulatory environments, where you are waiting for the vendor, the client, the regulator or anybody external to the project to move it forward. |
Activity on Arrow Method
The activity on arrow diagramming method involves the creation of a network of nodes and joining these nodes are arrows. All activities flow in one direction, typically from the left to the right and the actual activities and their durations are listed in the arrows. The nodes represent milestones, where there isn’t any work performed. All relationships are finish to start in an activity on arrow diagram.
Finish to start: Events occur in serial. You cannot start one activity until another activity finishes. Example, you cannot make the coffee until the water has boiled. There are many activities that can be done in parallel or overlap one another and as such, we see a case where Activity-On-Line diagrams don’t represent the real world that well.
Dummy Activities
How do you show complex dependencies when you cannot draw them on paper in activity on line diagrams? It may be impossible to draw an arrow from activity AC to activity AD due to tremendous complexity. The solution is to use dummy activities. These are activities that consume no time or resources and are displayed to show dependencies between different activities that would otherwise not be drawn. A dashed or dotted line represents a dummy activity
Precedence Diagramming Method (PDM/AON)
The precedence diagram method was developed to overcome some of the limitations of Activity-On-Line Diagrams. There are no dummy activities in this case. PDM is one of the most commonly used network diagramming techniques and you need to be familiar with how to construct and analyze these diagrams for the exam.
| Exam Tip –Definitions and terms: In studying for the exam, it is important to look at lists of terms and memorize those terms. Many questions require you to know the definitions of a term such as Float in order to correctly answer the questions. For example, there is a distinction between Lag and Slack that should be noted for the exam. |
The following list defines some of the most frequently used terms in network diagramming. You should develop a thorough understanding of these terms.
- Lag: Imposed Waiting Time. For example, when you paint a room, you will have to wait for the paint to dry once you paint the room. No resources are consumed in this case, while the paint is drying. Lag adds to the Duration of an activity.
- Negative Lag (Lead): The opposite of lag, this is the ability to jump ahead before you start the next activity in a Finish to Start Relationship.
- Critical Path: The critical path is the path through the network that takes the most amount of time. It represents the least amount of time with which the project can be completed. (see section below for full explanation)
- Slack (Float): Slack is the amount of time whereby a particular activity can be delayed without delaying the entire project. Slack is a function of the network and is calculated by looking at the network.
- Zero Slack: Activities on the Critical Path generally have zero slack, this doesn’t always have to be the case. Sometimes, the critical path is the path with the least float or slack. For example, if you have an imposed end date, it is possible to have a float of perhaps one or two days.
- Total Float: The Total Float is calculated by analyzing the network of a project. The Total Float does not affect the end date of the project. Typically, the Total Float can be defined by the Late Start minus the Early Start or the Late Finish minus the Early Finish.
- Free Float: This is an activity’s Float that does not have an impact on the next task in the network. Free float looks at how much this task can be delayed without impacting the very next task, also known as the nearest successor in the network.
Critical Path
The Critical Path is probably the most important concept when it comes to Project Time Management. The total duration of all the activities in a single path from start to finish is summed up to a number and expressed in days or hours. That number traces the longest path through the network and is also the shortest time in which the project can be completed. There can also be more than one Critical Path for a network in many projects. So don’t be fooled by a question that leads you to believe that there is only one Critical Path.
- Q: How do you determine if a task is critical?
- A: There is no slack or float for a particular activity.
PDM Relationships
There are different types of relationships connecting the activities depicted in Precedence Diagrams. The knowledge of these relationships is very important when we look at PDM.
- Finish-to-Start – Activity A must be 100% complete before Activity B starts. If you were to impose lag, then it would occur between these 2 activities. E.g. Activity “A” would finish and then n days later, “B” would start.
- Finish-to-Finish – We can use a Christmas family dinner as an example. Good cooks tend to time the preparation the various side dishes such that they finish at the same time as the main dish. This way all of the dishes can appear on the table at the same time, in a finish-to-finish relationship.
- Start-to-Start – Both events can start at the same time and can therefore run in parallel. There is no time lapse between the two activities. A time lapse might occur if there is lag time or an imposed waiting time.
- Start-to-Finish – For example, in some organizations, the selection process for Project Manager role has to be underway for at least 2 weeks before the proposal phase may finish. This is a way to ensure that all the candidates for the PM role have a chance to look at a proposal before it goes out the door. In this case, the Project Manager Selection Phase Starts with a lag time of 2 weeks, then the Proposal phase may finish for a project.
You will not be required to distinguish between different scenarios for the 4 types of relationships in the exam. Rather, you will have to determine how they are expressed. The terminology used in the question is what you have to pay attention to. For example, you need to know the precise terms, i.e. Finish-to-Finish and Start-to-Start and not “Beginning to End” or “End to Finish”
Crashing
Crashing represents a need to accelerate the schedule or reduce the duration of a project or phase within the project. Crashing almost always increases your cost, illustrating the interplay of the Triple Constraint we had discussed in the section on Project Integration management. The increase in costs can be due to a need to add more Human Resources or Equipment to the project or even allocating more salaried personnel in order to perform the work. Note that there is a cost for salaried project personnel. For example, as more of a project manager’s time is allocated to a project, there will be a cost relating to a loss in productivity due to fatigue.
When it comes to selecting the activities to crash, we only want to crash activities on the Critical Path. It is these activities that are directly impacting the duration of the Project. All other activities that do not lie on the Critical Path should have inherent float or slack and so expending resources to crash these non-critical path activities will result in comparatively less dramatic results to the duration of the total project. If you want to accelerate the project schedule, then you will have to find a way to reduce the duration of the critical path.
We want to look into crashing the activities where we are going to gain the most amount of time for the least amount of cost. You may also want to look at the rest of your network and try to determine the activities that are close to the critical path. If you crash your critical path too much, a new critical path may appear or you might end up adding these tasks onto your critical path as well.
Fast-tracking
For fast-tracking, we are attempting to do the project with the same defined amount of resources that we estimated, but we are trying to achieve the same work in less time. The way to do this is by running tasks in parallel. Such that once a particular task starts, we might start another task immediately. We are trying to work on more tasks at the same time. There is a disadvantage to Fast-tracking, which is the increase in level of risk and complexity: As you increase the complexity of a project, you inherently increase the risk and this increases the probability that the project might fail.
Concurrent Engineering: There is a technique that is similar to Fast-tracking and has appeared in the exams. Some people call this Fast-tracking. But it really is a planning technique or an approach to a project, where when be begin the project we have all the parties that will be somewhat involved in the project to be part of the initial project planning team.
The objective in this case is to become aware of all of the tasks in the project and plan for the tasks that have to be performed. This way, we are concurrently analyzing the work that we need to do and we are preparing for the work that has to be done. This can significantly help a project complete sooner as more people have been made aware of what they have to do earlier in the project. The key difference in this case is that while Fast-tracking looks at overlapping tasks, Concurrent Engineering looks at overlapping entire Phases.
Gantt chart
What is the best tool for planning and analyzing your project schedule? If you said Gantt Chart, that you answered incorrectly! Gantt charts are great presentation tools, however the PDM and Network Diagrams are the best tools to use for analysis because they show us relationships between different activities.
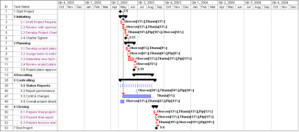
Fig 5-1. Gantt chart
The Gantt chart does not show all of the interrelationships between the activities. While Project Management software applications such as Microsoft Project and Basecamp.com commonly provide us with a Gantt Chart view of our project, not all of the relationships are displayed in the Gantt chart. We use the network diagram to see how every activity relates to every other activity for the project. This is the best tool to use for comprehensively planning out a project schedule.
The entire notion of a Gantt chart does not include dependency lines such as the arrows we see in Activity on Node diagrams. Technically, once we add Arrows to a Gantt chart, it is no longer a Gantt Chart, but instead a time-scale dependency diagram.
Milestone
A milestone is an activity with a duration of zero. It exists at a particular juncture in time that you have identified as being significant to the project and that you want to communicate to stakeholders. I.e. it could be the end of a phase or task or the delivery of a work result or even the expenditure of a certain sum of money. Milestones are very effective in communicating with upper management or the customer. The reason is that these parties may not be interested in looking at the technical details of the project. They may not even be able to understand some of the details at the lower levels of the WBS.
| Exam Tip –You may be asked in the exam if a kickoff meeting is a milestone. The answer is No. The kickoff meeting in its raw state takes a lot of time and resources. The kickoff meeting can be converted to a milestone as follows “Kickoff meeting complete.” Or “Kickoff meeting underway,” |
Develop Schedule
In this process, we develop the schedule by analyzing activity durations and sequences, related resource requirements and related dependencies. We will go through several techniques that can be used to develop an efficient schedule.
Types of Schedules
There are several classifications of schedules that can be created. Several are listed below:
- Heuristic Scheduling: This is also known as rule of thumb estimating; learning by discovery; or learning by trial and error. PERT is a good example of a form of heuristic scheduling.
- Resource-constrained Schedule: In a situation where there is competing demand between projects for a scarce resource, you end up updating and scheduling your project around the availability of this resource. An example could be the leasing of shared equipment or facilities; or the use of a subject-matter expert. The impact of varying resource availability is that the project has the potential to extend or shrink in duration.
- Time-constrained Schedule: This occurs in a scenario where the network schedule is fixed. In other words, there exists a fixed, hard coded date which we must adhere to by all means. For example during the Y2K readiness programmes for many businesses, December 31st 1999 was a hard set date of completion that could not vary.
Leveling
We want to ensure that we do not exhaust the resources that are working on our project. For example, if we try to crash a project or particular task, a particular resource might end up working 18 hours straight, which is not a sustainable level of effort. The objective of leveling is to establish a schedule where a resource is used in a pretty much consistent manner over time. A situation where there might be a bad allocation of resources is when a resource is utilized heavily in one period of time and not utilized at all in another period. Ideally, we want to find a way where the resource is used in a pretty much consistent manner over the duration of the project.
We recognize that our resources might be overworked and by performing leveling, we reduce the overcommitment of resources. Leveling inherently lengthens the project schedule, especially if the resource is required to perform a task on the critical path. However, if we have adequate float, or the resource is involved in an activity that is not on the critical path, then we may not lengthen the schedule.
Schedule Conflicts
Conflicts can arise between the project team and the client due to scheduling issues such as tasks or objectives being unable to be reached by a predetermined time. You need to be aware of certain tools which can aid the Project Manager in the process of resolving these conflicts.
- Resource Histogram: This is a bar chart that displays which resources are being used and across what time they are utilized.
- Resource Gantt: This is a Gantt chart that displays the tasks and responsibilities of individual resources. It shows the utilization of resources across a Gantt view. In the exam, you will be tested more on your knowledge the definition of this tool rather than on your ability to create or work with one.
- Responsibility Matrix: This is a list of the tasks and activities together with assigned resources for performing each particular task in the project.
Monte Carlo Simulation
There is very little emphasis on the exam for the technical details of Monte Carlo. Monet Carlo is an iterative process and is performed many times, usually on a computer. Monte Carlo takes the individual activities in a project and looks at what the range of variability is for each activity. Each time we run a simulation, we vary an individual activity slightly to see how it impacts the overall project. By running thousands of simulations, patterns start to emerge and we can start prioritizing activities that have the greatest impact on the project that we want to look out for.
For example, Activity A may take between 3 to 5 days to complete and activity B may take between 4 and 6 days. We input these possible combinations of activities into a model and run a simulation to see how changes to these activity durations may impact the overall project finish date. The first time we run the simulation, we might come up with a duration of 3 days for Activity A and 6 days for activity B. The next iteration might result in 4 days for Activity A and 5 days for Activity B. The process may be repeated many thousands of times in order to build a statistical regression of possible outcomes.
All that we need to know is that Monte Carlo Simulations are run iteratively based on parameters of a particular activity to see where the schedule will generally fall out. Monte Carlo also tends to be a lot more pessimistic in nature than CPM and PERT. This is because Monte Carlo accounts for all of the near-critical paths. PERT is more pessimistic than CPM because CPM works on a single data point duration whereas PERT includes the most pessimistic duration estimates.
Summary: Project Time Management.
- Activity Estimation
- Activity Sequencing
- PERT and CPM
- AON and AOA Diagrams
- Crashing and Fast Tracking
- Leveling
Conclusion
In this section, we looked at another component of the Triple Constraint, Project Time Management. We learnt that Project Time Management typically takes place after we build a WBS and utilizes the concepts of decomposition to build an activity list, sequence these activities and build up duration estimates for these activities. We build project schedules using tools such as our Activity on Arrow and Precedence Diagramming Methods a.k.a. Activity on Node diagrams. We use concepts such as the Critical Path to focus our efforts in managing potentially complex networks that could have thousands of paths. Finally we use concepts such as Crashing, Fast-tracking and Leveling to manage our networks.
In the next section, we will review the third Triple Constraint, Project Cost Management.
The Chimp says, “Have a drink, you deserve it!”
Ook!
Trackbacks/Pingbacks